
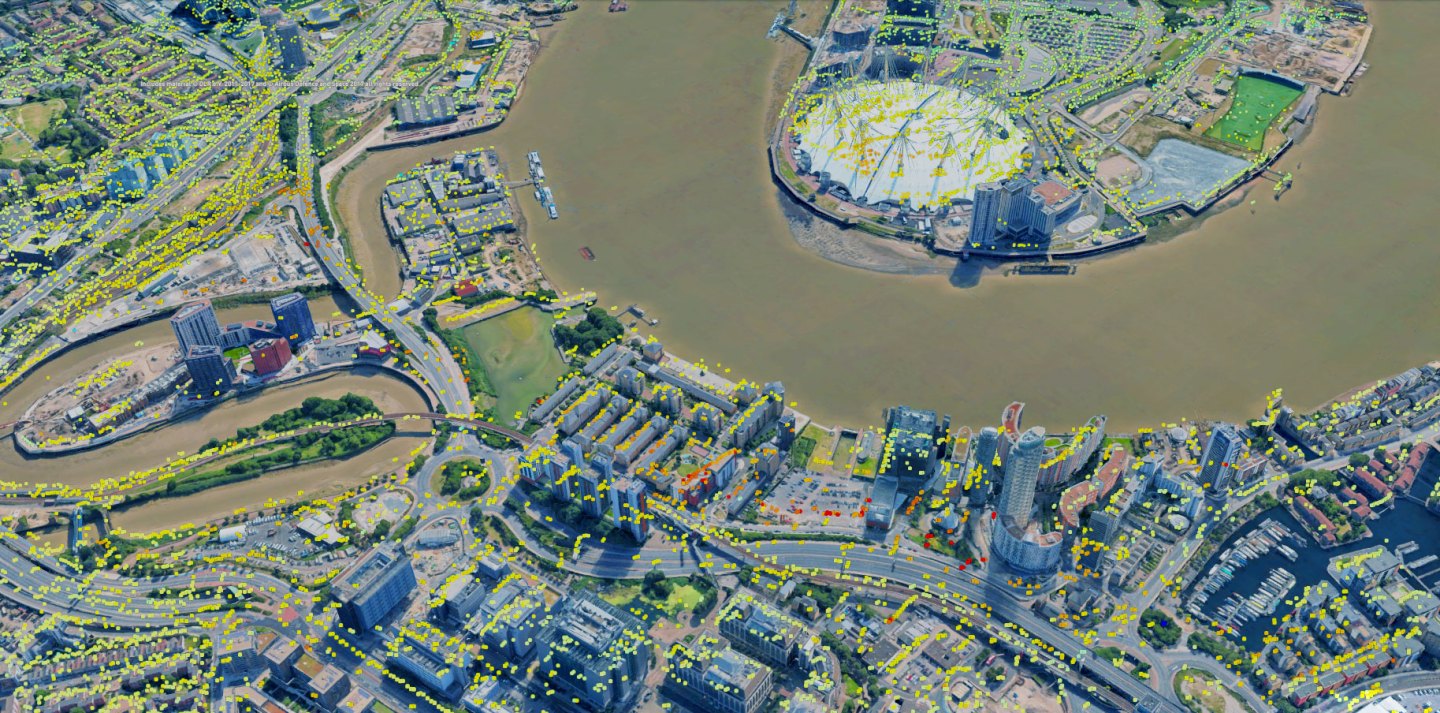
Experience TREmaps®: A sophisticated, web-based platform designed to deliver, visualize, and manage high-precision InSAR results.

Advanced analytical tools
TREmaps® offers a suite of sophisticated tools to help you interpret ground deformation data to make faster, more informed decisions.
- Time series analysis: Interrogate individual or multiple measurement points to see the full history of movement. Detect seasonal trends, acceleration, or stabilization over time
- Dynamic filtering: Refine your view based on velocity thresholds, data quality (coherence), or specific date ranges to eliminate noise and focus on critical alerts
- Polygon statistics: Define specific areas of interest (AOIs) to calculate average deformation rates and extract summary statistics for localized zones
- Cross-section profiles: Generate vertical profiles to understand deformation along linear infrastructures like pipelines, railways, or embankments


Flexible exports and API-driven automation
Designed to work with your existing geospatial ecosystem:
- External layers: Overlay WMS/WMTS public services
- Flexible exports: Download results in industry-standard formats including SHP, CSV, GeoDatabase, and KML for use in your own GIS or CAD software
- API access: Robust APIs available for enterprise-level automation and third-party software integration
TREmaps® is:
- Developed and maintained by TRE ALTAMIRA’s in-house team to deliver cutting-edge performances
- Built on Google Maps for a familiar, global interface, guaranteeing industry-leading uptime and high-level SLAs for mission-critical data
- Secured: It protects your data with encrypted, role-based access and individualized credentials